
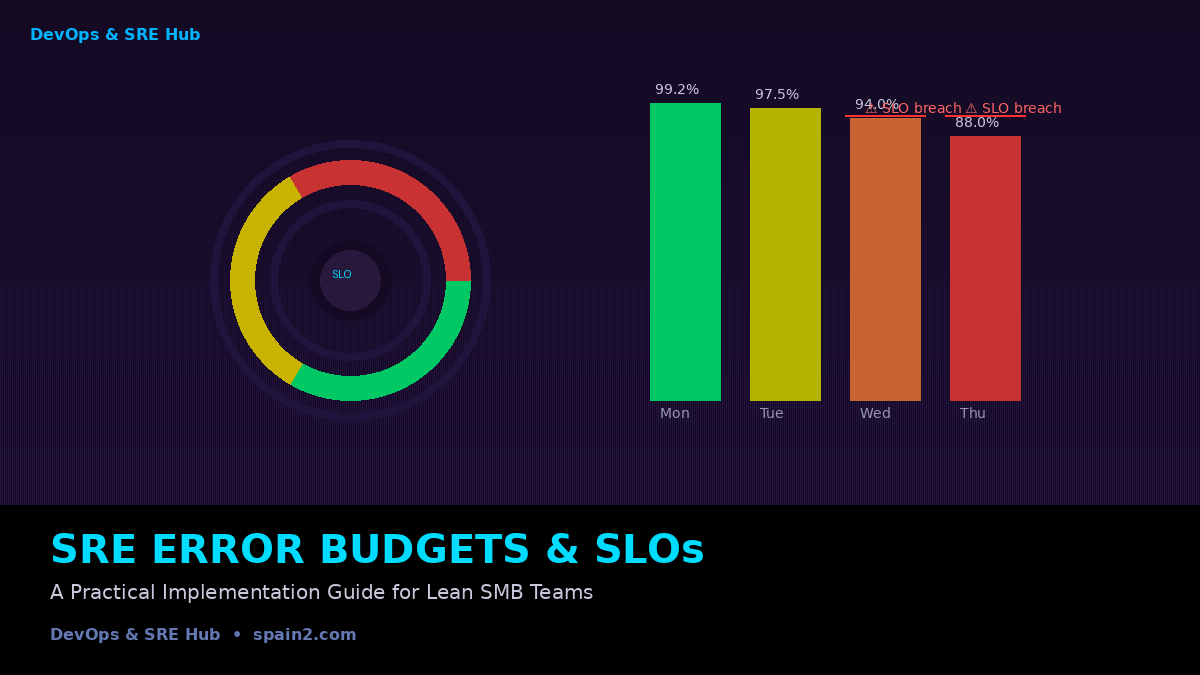
Why Error Budgets Matter More Than Uptime
Most SMBs measure reliability by a single metric: uptime. “We need 99.9% availability” sounds great in a board meeting, but it’s a terrible operational target. Uptime tells you if your service was running, not if it was working. It doesn’t distinguish between a 3-second blip during off-hours and a 30-minute outage at peak traffic. Worse, a rigid uptime target discourages the very thing that drives innovation — deploying new features.
This is where Service Level Objectives (SLOs) and Error Budgets come in. These Site Reliability Engineering concepts, popularized by Google, give your team a scientific framework for balancing reliability with velocity. In 2026, they’re not just for Google-scale operations. SMBs with lean teams can implement SLOs in a single sprint and start making better decisions immediately.
In this guide, you’ll learn how to define meaningful SLOs, calculate error budgets, set up burn-rate alerts, and integrate everything into your existing monitoring stack — without adding a single headcount.
What Are SLOs, SLIs, and Error Budgets?
Let’s define the three terms clearly before we dive in:
- SLI (Service Level Indicator) — A quantitative measure of a service property, such as request latency, error rate, or throughput. Example: “fraction of HTTP GET requests that complete in under 500ms.”
- SLO (Service Level Objective) — A target value or range for an SLI. Example: “99.5% of HTTP GET requests complete in under 500ms, measured over a 30-day rolling window.”
- Error Budget — The acceptable amount of unreliability. If your SLO is 99.5%, your error budget is 0.5% of total requests. Once burned, teams should slow down feature releases to focus on reliability.
The key insight: error budgets give you permission to fail. As long as you have budget remaining, you can deploy freely. When the budget runs low, you stop releasing and invest in reliability. This replaces the toxic culture of “never deploy on Friday” with a data-driven release policy.
This concept complements the DORA metrics framework we’ve covered — while DORA measures your throughput and stability, SLOs define the specific reliability targets your users expect.
Step 1: Identify Your Most Critical Service
Don’t try to create SLOs for every service at once. Start with one — your most business-critical endpoint. For most SMBs, this is the user-facing API gateway or the customer-facing web application. Use the “what hurts most when it breaks” heuristic.
Ask yourself:
- If this service goes down, do we lose revenue immediately?
- Do customer support tickets spike when this is slow?
- Is this in the critical path for every user action?
That’s your first SLI target. As you grow, our infrastructure maturity self-assessment can help you identify which services to instrument next.
Step 2: Define Your First SLI
Stick to two SLIs for your first service: latency and error rate. These cover the majority of user-facing reliability concerns.
For latency, use the p95 or p99 percentile, not the average. Average latency hides problems — 99% of requests completing in 100ms and 1% taking 10 seconds gives an average of 199ms, which looks fine but causes real user pain.
Here’s a concrete example using PromQL (Prometheus Query Language) to define your SLIs:
# SLI 1: Request Latency (p99) — fraction of requests under 500ms
# For each 1-minute window, compute p99 latency
histogram_quantile(0.99,
  sum(rate(http_request_duration_seconds_bucket[1m])) by (le)
)

# The SLI: count of requests under 500ms / total requests
(
  sum(rate(http_request_duration_seconds_bucket{le="0.5"}[1m]))
  /
  sum(rate(http_request_duration_seconds_count[1m]))
)

# SLI 2: Error Rate — fraction of requests returning 5xx
(
  sum(rate(http_requests_total{status=~"5.."}[1m]))
  /
  sum(rate(http_requests_total[1m]))
)
Step 3: Calculate Your Error Budget
Once you have SLIs, define your SLO. A reasonable starting point for most SMB services is 99.5% availability over a 30-day rolling window. Here’s what that means in practical terms:
Total requests per month (example):   10,000,000
SLO target:                           99.5%
Allowed failed requests (error budget): 50,000 (0.5%)

Error budget burn rate:
- If you burn 25,000 errors (50% of budget) in the first week,
  you have only 25,000 errors left for the remaining 3 weeks.
- At this rate, you'll exhaust the budget in 2 weeks.
- Time to slow down releases and fix reliability.
Here’s a Python script to calculate your error budget from Prometheus metrics:
#!/usr/bin/env python3
"""Error Budget Calculator — Run weekly in CI/CD to gate deployments."""
import requests
import sys

PROMETHEUS_URL = "http://prometheus:9090"
SLO_TARGET = 0.995  # 99.5%

def query_prometheus(query):
    resp = requests.get(f"{PROMETHEUS_URL}/api/v1/query",
                        params={"query": query})
    return resp.json()["data"]["result"]

# Total requests in last 30 days
good = float(query_prometheus(
    'sum(increase(http_request_duration_seconds_count{le="0.5"}[30d]))'
)[0]["value"][1])
total = float(query_prometheus(
    'sum(increase(http_request_duration_seconds_count[30d]))'
)[0]["value"][1])

actual_availability = good / total
error_budget_consumed = 1 - (actual_availability / SLO_TARGET)

print(f"Good requests:  {good:,.0f}")
print(f"Total requests: {total:,.0f}")
print(f"Availability:   {actual_availability:.4%}")
print(f"SLO target:     {SLO_TARGET:.2%}")
print(f"Budget burned:  {error_budget_consumed:.2%}")

if error_budget_consumed > 0.75:
    print("⚠️  CRITICAL: Over 75% of error budget consumed. FREEZE DEPLOYMENTS.")
    sys.exit(1)
elif error_budget_consumed > 0.50:
    print("⚠️  WARNING: Over 50% of error budget consumed. Reduce deploy velocity.")
else:
    print("✅ Error budget healthy. Deploy freely.")
Integrate this into your CI/CD pipeline as a quality gate. When the error budget is depleted, the pipeline fails and developers must address reliability before deploying new features. This replaces the emotional rollercoaster of manual deployment decisions with objective data.
Step 4: Set Up Burn-Rate Alerts
An SLO that you only check once a month is retrospective. You need burn-rate alerts that warn you when you’re consuming error budget too quickly. Google SRE recommends multi-window alerting with short (1-hour) and long (6-hour) windows:
# Prometheus alerting rule — Burn Rate Alert
# Alert if burning budget at 10x the expected rate for 1 hour
alert: HighErrorBudgetBurnRate
expr: |
  (
    (
      1 - (
        sum(rate(http_request_duration_seconds_count{le="0.5"}[1h]))
        / sum(rate(http_request_duration_seconds_count[1h]))
      )
    )
    >
    (1 - 0.995) * 10  # 10x the allowed error rate
  )
for: 5m
labels:
  severity: critical
annotations:
  summary: "Error budget burning too fast on {{ $labels.service }}"
  description: "Error budget consumed at >10x expected rate for 1h window."

# Page if budget burns at 2x the expected rate for 6 hours
alert: MediumErrorBudgetBurnRate
expr: |
  (
    (
      1 - (
        sum(rate(http_request_duration_seconds_count{le="0.5"}[6h]))
        / sum(rate(http_request_duration_seconds_count[6h]))
      )
    )
    >
    (1 - 0.995) * 2  # 2x the allowed error rate
  )
for: 30m
labels:
  severity: warning
annotations:
  summary: "Sustained error budget burn on {{ $labels.service }}"
These alerts should page your on-call engineer only when the budget is burning fast enough to exhaust it within hours or days. Everything else is a dashboard, not a page. This aligns with our alerting best practices — sensible defaults that don’t wake you up unnecessarily.
Step 5: Visualize Your Error Budget
A dashboard makes error budget status visible to the whole team. Here’s a Grafana dashboard JSON snippet for your error budget:
{
  "title": "Error Budget — Production API",
  "panels": [
    {
      "type": "gauge",
      "title": "Error Budget Remaining",
      "targets": [{
        "expr": "(
          1 - (
            1 - (
              sum(increase(http_request_duration_seconds_count{le="0.5"}[30d]))
              / sum(increase(http_request_duration_seconds_count[30d]))
            )
          ) / (1 - 0.995)
        ) * 100",
        "legendFormat": "Budget Remaining (%)"
      }],
      "gauge": {
        "show": true,
        "minValue": 0,
        "maxValue": 100,
        "thresholdMarkers": [
          {"value": 25, "color": "red"},
          {"value": 50, "color": "orange"},
          {"value": 100, "color": "green"}
        ]
      }
    },
    {
      "type": "graph",
      "title": "Error Budget Burn Rate (7 days)",
      "targets": [{
        "expr": "(
          1 - (
            sum(rate(http_request_duration_seconds_count{le="0.5"}[1h]))
            / sum(rate(http_request_duration_seconds_count[1h]))
          )
        ) / (1 - 0.995)",
        "legendFormat": "Burn Rate (1=expected)"
      }]
    }
  ]
}
Display this on a team monitor in your common area. When the gauge drops below 25%, it’s visible to everyone, not just the on-call engineer. This shared visibility builds a culture of collective ownership for reliability, as explored in our AI SREs article.
Common SMB Pitfalls and How to Avoid Them
- Pitfall: Too many SLOs — Start with 2 SLIs per service, max 2 services. You can add more later. Each additional SLO increases cognitive load and alert noise.
- Pitfall: 100% target — 100% availability is mathematically impossible and operationally toxic. It guarantees alert fatigue and burnout. Always leave room in your error budget.
- Pitfall: Ignoring burn rates — A monthly SLO review catches problems too late. Alert on burn rates, not just monthly totals.
- Pitfall: Setting and forgetting — Review your SLOs quarterly. As your service evolves, user expectations change. What was acceptable latency in Q1 may not be in Q3.
- Pitfall: No SLO for external dependencies — If your API depends on a third-party service, track its SLO separately. You can’t control it, but you can measure it and make business decisions accordingly.
From SLOs to Operational Excellence
Error budgets are more than a reliability tool — they’re a cultural catalyst. When your team knows exactly how much “failure budget” they have, they deploy with confidence. When the budget is depleted, they stop shipping features and fix the root cause without guilt. This data-driven approach to reliability directly supports the SMB Infrastructure Maturity Model, particularly as you transition from Level 3 (Measured) to Level 4 (Automated).
The best part? You can implement all of this with open-source tools you’re likely already running: Prometheus and Grafana. No enterprise licenses, no consultants, no new headcount. Just clear thinking and a weekend of configuration.
Conclusion
SLOs and error budgets transform reliability from a guessing game into a science. By defining what matters, measuring it accurately, and using error budgets to make deployment decisions, your SMB team can achieve enterprise-grade reliability practices without enterprise complexity. Start with one service, two SLIs, and one Grafana dashboard. Iterate from there.
Need help implementing SLOs and error budgets in your stack? Book a free 30-minute consultation — our SRE experts will help you define your first SLOs and set up burn-rate alerts in under a week.
 English
  Español